Table of Contents
Sum
Sums the different elements of a spectrum object multiplied by the numbers given as a list in the input. Several lists are possible. Can be used to calculate the temperature dependence of a set of spectra.
Example
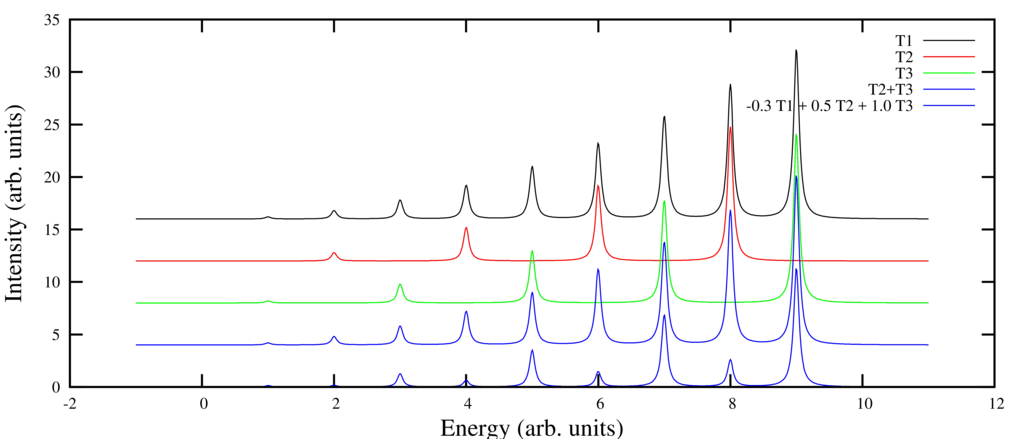
Create the sum of the spectra created with operator T2 and T3 and calculate a weighted sum over the spectra created with operator T1, T2 and T3.
Input
- Example.Quanty
dofile("definitions.Quanty")

G2plus3 = Spectra.Sum(G,{0,1,1},{-0.3,0.5,1.0})


G.Print({{"file","Spectra.dat"}})
G2plus3.Print({{"file","Spectra.Sum.dat"}})

gnuplotScript = gnuplotHead .. [[
set output "Spectra.Sum.ps"
plot "Spectra.dat"     using 1:(-$3+16) title 'T1'    with lines ls  1,\
     "Spectra.dat"     using 1:(-$5+12) title 'T2'    with lines ls  2,\
     "Spectra.dat"     using 1:(-$7+8 ) title 'T3'    with lines ls  3,\
     "Spectra.Sum.dat" using 1:(-$3+4 ) title 'T2+T3' with lines ls  4,\
     "Spectra.Sum.dat" using 1:(-$5   ) title '-0.3 T1 + 0.5 T2 + 1.0 T3' with lines ls  4
]]
file = io.open("Spectra.Sum.gnuplot", "w")
file:write(gnuplotScript)
file:close()

os.execute("gnuplot Spectra.Sum.gnuplot")
os.execute("convert -density 1024 Spectra.Sum.ps -resize 1024 Spectra.Sum.png")
Result
The resulting picture is:
